Maintenance release includes several bug fixes.
Fixes
DevExpress has released a maintenance update across their entire product range.
DevExpress has released a maintenance update across their entire product range.
ExpressBars Suite
ExpressEditors Library
ExpressExport Library
ExpressLibrary
ExpressMap Control
ExpressPDFViewer
ExpressPrinting System
ExpressQuantumGrid Suite
ExpressQuantumTreeList Suite
ExpressRichEdit Control
ExpressScheduler Suite
ExpressSpreadSheet
ExpressWizard Control
Installation (VCL)
Create interactive charts easily for your web projects.
An SVG-based, multi-platform charting library that makes it easy to add interactive, mobile-optimized charts to your web and mobile projects. It features robust documentation, advanced responsiveness and industry-leading accessibility support.
Separate wrappers for .NET and iOS also available:-
High-performance charting library.
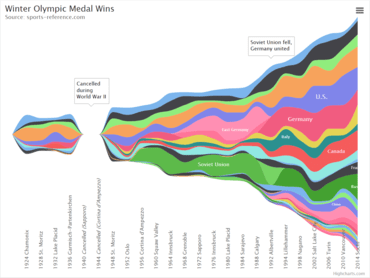
Create stock or general timeline charts in pure JavaScript. Including sophisticated navigation options like a small navigator series, preset date ranges, date picker, scrolling and panning.
Interactive map charts with drilldown and touch support.
Build interactive maps to display sales, election results or any other information linked to geography. Perfect for standalone use or in dashboards in combination with Highcharts!
Highstock, Highcharts and Highmaps in one license bundle, with Premium Support.
Allows an agreed number of developers in your company to work with the Highcharts API, customize, implement, and work on design - source editing is also allowed. It can be used with an unlimited number of SaaS projects, web applications, intranets, and websites. In addition, Highcharts Editor and Highcharts Export Server is included.
About Highsoft
Highsoft produce data visulaization solutions through it's popular JavaScript charting engine, Highcharts JS, Highstock JS and Highmaps JS. Highsoft is located in Vik i Sogn, Norway, and has sold over 45,000 licenses to customers including the Fortune 100.
Create stock or general timeline charts in pure JavaScript. Including sophisticated navigation options like a small navigator series, preset date ranges, date picker, scrolling and panning.
Highstock, Highcharts and Highmaps in one license bundle, with Premium Support.
Allows an agreed number of developers in your company to work with the Highcharts API, customize, implement, and work on design - source editing is also allowed. It can be used with an unlimited number of SaaS projects, web applications, intranets, and websites. In addition, Highcharts Editor and Highcharts Export Server is included.
About Highsoft
Highsoft produce data visualization solutions through it's popular JavaScript charting engine, Highcharts JS, Highstock JS and Highmaps JS. Highsoft is located in Vik i Sogn, Norway, and has sold over 45,000 licenses to customers including the Fortune 100.
An SVG-based, multi-platform charting library that makes it easy to add interactive, mobile-optimized charts to your web and mobile projects. It features robust documentation, advanced responsiveness and industry-leading accessibility support.
Separate wrappers for .NET and iOS also available:-
Highstock, Highcharts and Highmaps in one license bundle, with Premium Support.
Allows an agreed number of developers in your company to work with the Highcharts API, customize, implement, and work on design - source editing is also allowed. It can be used with an unlimited number of SaaS projects, web applications, intranets, and websites. In addition, Highcharts Editor and Highcharts Export Server is included.
About Highsoft
Highsoft produce data visualization solutions through it's popular JavaScript charting engine, Highcharts JS, Highstock JS and Highmaps JS. Highsoft is located in Vik i Sogn, Norway, and has sold over 45,000 licenses to customers including the Fortune 100.
Highcharts Suite includes Highcharts, Highstock and Highmaps in one license bundle, with Premium Support.
Allows an agreed number of developers in your company to work with the Highcharts API, customize, implement, and work on design - source editing is also allowed. It can be used with an unlimited number of SaaS projects, web applications, intranets, and websites. In addition, Highcharts Editor and Highcharts Export Server is included.
Create interactive charts easily for your web projects.
An SVG-based, multi-platform charting library that makes it easy to add interactive, mobile-optimized charts to your web and mobile projects. It features robust documentation, advanced responsiveness and industry-leading accessibility support.
Separate wrappers for .NET and iOS also available:-
High-performance charting library.
Create stock or general timeline charts in pure JavaScript. Including sophisticated navigation options like a small navigator series, preset date ranges, date picker, scrolling and panning.
Interactive map charts with drilldown and touch support.
Build interactive maps to display sales, election results or any other information linked to geography. Perfect for standalone use or in dashboards in combination with Highcharts!
About Highsoft
Highsoft produce data visualization solutions through it's popular JavaScript charting engine, Highcharts JS, Highstock JS and Highmaps JS. Highsoft is located in Vik i Sogn, Norway, and has sold over 45,000 licenses to customers including the Fortune 100.
TeeBI is a component suite for Embarcadero RAD Studio, Delphi and C++, VCL and Firemonkey frameworks, designed to help developers provide integrated and easily usable data analysis services in their own developed applications.
TeeBI provides a Core engine that can be configured to connect to a wide variety of data and information sources across a variety of data providers and formats. The TeeBI Core creates a common metadata format for all the information sources enabling homogeneous access for all visualization and analysis tools. To this data you can make links, view in Chart, Grid or Tree formats or create triggers to bulletin data events. Output to the desktop or to the web or create new, consolidated datasources for further data analysis. TeeBI includes Geo-mapping capabilities to bring location data, automatically to your data.
TeeBI for RAD Studio Suite includes Visualization, Web and Analysis components for RAD Studio with 100% source code.
HTML JS
Data Grid
Data Visualization
DevExtreme Core
DevExtreme Demos
IDE Integration
Pivot Grid
Scheduler
Tree List
UI Widgets
ASP.NET MVC
Data Grid
Data Visualization
DevExtreme Demos
IDE Integration
All WPF Controls
DXCharts for WPF
DXControls for WPF
DXDiagram for WPF
DXDocking for WPF
DXEditors for WPF
DXGrid for WPF
DXMap for WPF
DXNavBar for WPF
DXPivotGrid for WPF
DXPropertyGrid for WPF
DXRibbon for WPF
DXRichEdit for WPF
DXScheduler for WPF
DXScheduler for WPF (Legacy)
DXSpreadsheet for WPF
DXTreeList for WPF
MVVM Framework
PDF Viewer for WPF
Theme Editor
XtraReports Suite
All WinForms Controls
PDF Viewer
Project Templates
Snap
XtraBars Suite
XtraCharts Suite
XtraEditors Library
XtraGrid Suite
XtraLayout Suite
XtraMap
XtraNavBar
XtraPivotGrid Suite
XtraPrinting Library
XtraReports Suite
XtraRichEdit
XtraScheduler Suite
XtraSpellChecker
XtraSpreadsheet
XtraTreeList Suite
XtraTreeMap
XtraVerticalGrid Suite
Charts for Windows 10 Apps
Editors for Windows 10 Apps